Code Debugging Techniques
Debugging plays an important role in the process of creating software, which is to allow us to follow the implementation of our program step by step. With this technique we can follow the values of the local variables, because they are changing during the execution of the program, and to remove possible errors (bugs). The process of debugging includes:
- Finding the problems (bugs).
- Locating the code, which causes the problems.
- Correcting the code, which causes the problems, so that the program works correctly.
- Testing to make sure that the program works correctly after the corrections we have made.
Debugging in Visual Studio
Visual Studio gives us a built-in debugger, thanks to which we can place breakpoints at places we have chosen. When it reaches a breakpoint, the program stops running and allows step-by-step running of the remaining lines. Debugging allows us to get in the details of the program and see where exactly the errors occur and what is the reason for this.
In order to demonstrate how to use the debugger in VS, we will use the following C# program:
static void Main(string[] args)
{
    for (int i = 0; i < 100; i++)
    {
        Console.WriteLine(i);
    }
}
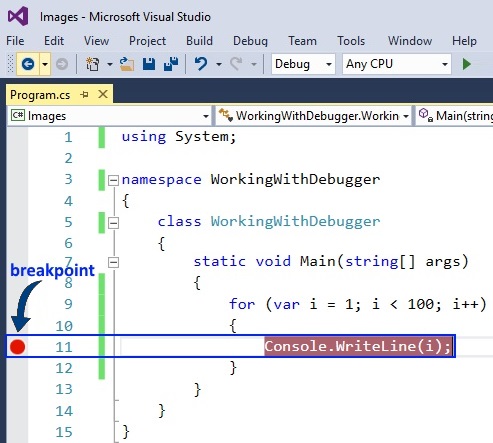
We will place a breakpoint at the function Console.WriteLine(…). For this we will need to move our cursor to the line, which prints on the console, and press [F9]. A breakpoint appears, showing where the program will stop running:
Starting the Program in Debug Mode
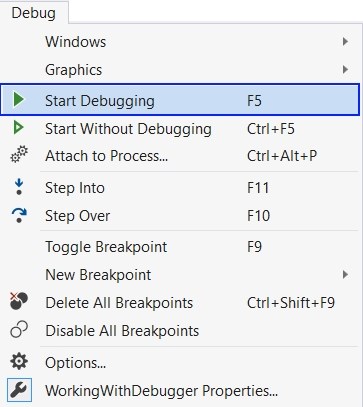
In order to start the program in debug mode, we choose [Debug] -> [Start Debugging] or press [F5]:
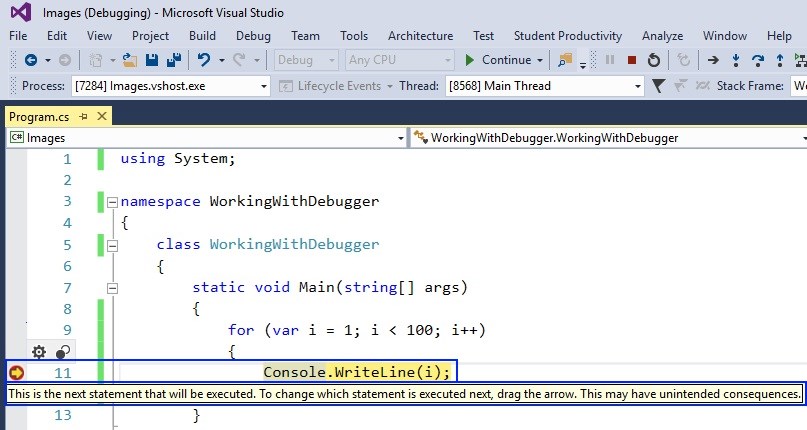
After starting the program, we can see that it stops executing at line 11, where we placed our breakpoint. The code in the current line is colored in yellow and we can run it step by step. In order to go to the next line, we use the key [F10]. We can see that the code on the current line hasn't executed yet and it is displayed in yellow. It will execute when we go ahead with the debugging the next line.
The screenshot below shows the Visual Studio debugger, stopped at the breakpoint and waiting for the developer to decide what to do (e.g. execute the next command or stop the program):
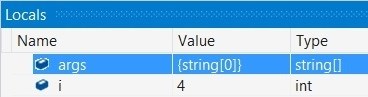
From the Locals window we can observe the changes in the local variables or modify their values at runtime. In order to open the window, you must choose [Debug] -> [Windows] -> [Locals].