Problem: Grades
Write a program that calculates statistics for grades in an exam. At the beginning, the program reads the number of students who attended the exam and for each student – their grade. At the end, the program must print the percentage of students that have grades between 2.00 and 2.99, between 3.00 and 3.99, between 4.00 and 4.99, 5.00 or more, as well as the average grade of the exam.
Note: we use the Bulgarian grading system, where the grade scale starts from 2.00 (Fail) and ends at 6.00 (Excellent): https://en.wikipedia.org/wiki/Grading_systems_by_country#Bulgaria.
Input Data
Read from the console a sequence of numbers, each on a separate line:
- On the first line – the number of students who attended the exam – an integer within the range [1 … 1000].
- For each individual student on a separate line – the grade on the exam – a real number within the range [2.00 … 6.00].
Output Data
Print on the console 5 lines that hold the following information:
- "Top students: {percentage of students with grade of 5.00 or more}%".
- "Between 4.00 and 4.99: {between 4.00 and 4.99 included}%".
- "Between 3.00 and 3.99: {between 3.00 and 3.99 included}%".
- "Fail: {less than 3.00}%".
- "Average: {average grade}".
The results must be formatted up to the second symbol after the decimal point.
Sample Input and Output
| Input | Output | Comments |
|---|---|---|
| 6 2 3 4 5 6 2.2 |
Top students: 33.33% Between 4.00 and 4.99: 16.67% Between 3.00 and 3.99: 16.67% Fail: 33.33% Average: 3.70 |
5 or more: 2 students = 33.33% of 6 Between 4.00 and 4.99: 1 student = 30% of 6 Between 3.00 and 3.99: 1 student = 20% of 6 Below 3: 2 students = 20% of 6 The average grade is: 2 + 3 + 4 + 5 + 6 + 2.2 = 22. 2 / 6 = 3.70 |
| Input | Output | Comments |
|---|---|---|
| 10 3.00 2.99 5.68 3.01 4 4 6.00 4.50 2.44 5 |
Top students: 30.00% Between 4.00 and 4.99: 30.00% Between 3.00 and 3.99: 20.00% Fail: 20.00% Average: 4.06 |
5 or more: 3 students = 30% of 10 Between 4.00 and 4.99: 3 students = 30% of 10 Between 3.00 and 3.99: 2 students = 20% of 10 Below 3: 2 students = 20% of 10 The average grade is: 3 + 2.99 + 5.68 + 3.01 + 4 + 4 + 6 + 4.50 + 2.44 + 5 = 40.62 / 10 = 4.062 |
Hints and Guidelines
We will divide the problem into smaller sub-problems, as described below.
Reading the Input Data and Creating Helper Variables
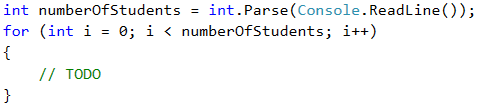
By the requirements we see that first we will read the number of students, and then, their grades. For that reason, firstly in a variable of int type we will read the number of students. In order to read and process the grades themselves, we will use a for loop. The value of the int variable will be the end value of the i variable from the loop. This way, all iterations of the loop will read each one of the grades.
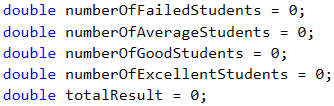
Before executing the code of the for loop, we will create variables where we will store the number of students for each group: poor results (up to 2.99), results from 3 to 3.99, from 4 to 4.99 and grades above 5. We will also need one more variable, where we will store the sum of all grades, via which we will calculate the average grade of all students.
Allocating Students into Groups
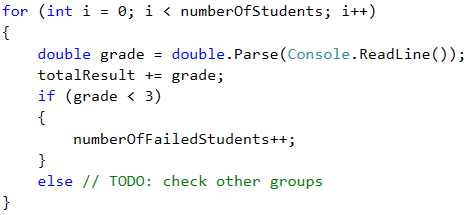
We run the loop and inside it we declare one more variable, in which we will store the currently entered grade. The variable will be double type and upon each iteration we will check what is its value. According to this value, we increase the number of students in the relevant group by 1, as we should not forget to also increase the total amount of the grades, which we also track.
We can calculate what percentage is taken by a particular group of students from the total number by multiplying the number of students in the relevant group by 100 and then dividing this by the total number of students.
| Pay attention to the numeric data type that you work with upon doing these calculations. |
The end result is formed in the well know fashion – up to the second symbol after the decimal point.
Testing in the Judge System
Test your solution here: https://judge.softuni.org/Contests/Practice/Index/517#3.