Problem: Histogram
We have n integer numbers within the range of [1 … 1000]. Some percent of them p1 are under 200, another percent p2 are from 200 to 399, percent p3 are from 400 to 599, percent p4 are from 600 to 799 and the rest p5 percent are from 800 upwards. Write a program that calculates and prints the percentages p1, p2, p3, p4 and p5.
Example: we have n = 20 numbers: 53, 7, 56, 180, 450, 920, 12, 7, 150, 250, 680, 2, 600, 200, 800, 799, 199, 46, 128, 65. We get the following distribution and visualization:
| Group | Numbers | Numbers Count | Percent |
|---|---|---|---|
| < 200 | 53, 7, 56, 180, 12, 7, 150, 2, 199, 46, 128, 65 | 12 | p1 = 12 / 20 * 100 = 60.00% |
| 200 … 399 | 250, 200 | 2 | p2 = 2 / 20 * 100 = 10.00% |
| 400 … 599 | 450 | 1 | p3 = 1 / 20 * 100 = 5.00% |
| 600 … 799 | 680, 600, 799 | 3 | p4 = 3 / 20 * 100 = 15.00% |
| ≥ 800 | 920, 800 | 2 | p5 = 2 / 20 * 100 = 10.00% |
Input Data
On the first line of the input there is an integer n (1 ≤ n ≤ 1000) that represents the count of lines of numbers that will be passed. On each of the following n lines we have one integer within range of [1 … 1000] – numbers, on which we have to calculate the histogram.
Output Data
Print on the console a histogram that consists of 5 lines, each of them containing a number within the range of [0% … 100%], formatted up to two digits after the decimal point (for example 25.00%, 66.67%, 57.14%).
Sample Input and Output
| Input | Output | Input | Output |
|---|---|---|---|
| 3 1 2 999 |
66.67% 0.00% 0.00% 0.00% 33.33% |
4 53 7 56 999 |
75.00% 0.00% 0.00% 0.00% 25.00% |
| Input | Output | Input | Output |
|---|---|---|---|
| 7 800 801 250 199 399 599 799 |
14.29% 28.57% 14.29% 14.29% 28.57% |
9 367 99 200 799 999 333 555 111 9 |
33.33% 33.33% 11.11% 11.11% 11.11% |
| Input | Output |
|---|---|
| 14 53 7 56 180 450 920 12 7 150 250 680 2 600 200 |
57.14% 14.29% 7.14% 14.29% 7.14% |
Hints and Guidelines
We can split the program that solves this problem into three parts:
- Reading the input data – in the current problem this includes reading of the number n, followed by n count of integers, each on a single line.
- Processing the input data – in this case that means allocating the numbers into groups and calculating the percentage breakdown by groups.
- Printing the output – printing the histogram on the console in the specified format.
Before we proceed, we will make a small deviation from the current topic, namely, we will briefly mention that in programming every variable has a certain data type. In this problem we will use the numeral types int for integers and double for real numbers. Often, to make it easier, programmers miss the explicit specification of the type by replacing it with the keyword var. For better understanding we will write the type upon declaring the variables.
We will now proceed with the implementation of each of the above points.
Reading the Input Data
Before we proceed to reading the input data, we must declare the variables, in which we will store it. This means choosing the right data type and appropriate names.
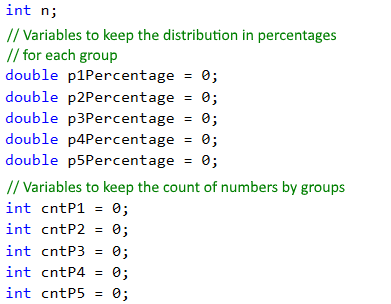
In the variable n we will store the count of numbers that we will read from the console. We choose int type, because n is an integer within the range from 1 to 1000. For the variables in which we will store the percentages, we choose double type, because they are not expected to always be integers. Additionally, we declare the variables cntP1, cntP2 etc., in which we will keep the count of the numbers from the respective group, and we choose again int type.
After we have declared the needed variables, we can read the number n from the console:

Distributing Numbers in Groups
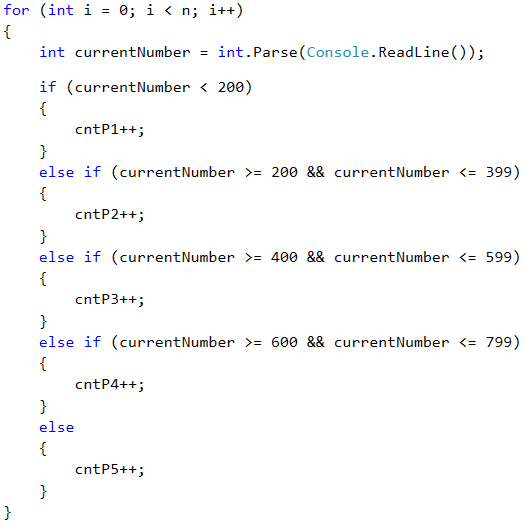
To read and distribute each number in its corresponding group, we will use a for loop from 0 to n (count of numbers). Every iteration of the loop will read and distribute one single number (currentNumber) into its corresponding group. In order to determine if a number belongs to a group, we perform a check in its respective range. If the above is true, we increase the count of the numbers in the corresponding group (cntP1, cntP2 etc.) by 1.
Calculating Percentages
After we have determined how many numbers there are in each group, we can move on to calculating the percentages, which is the main purpose of the problem. For this we will use the following formula:
(group percentage) = (count of numbers in group) * 100 / (count of all numbers)
This formula in the program code looks like this:
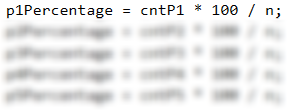
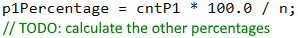
If we divide by 100 (int number type) instead of 100.0 (double number type), we will perform the so-called integer division and the variable will save only the whole part of the division, and this is not the result we want. For example: 5 / 2 = 2, but 5 / 2.0 = 2.5. Considering this, the formula for the first variable will look like this:
To make it even clearer, let's take a look at the following example:
| Input | Output |
|---|---|
| 3 1 2 999 |
66.67% 0.00% 0.00% 0.00% 33.33% |
In this case n = 3.
For the loop we have:
i = 0– we read the number 1, which is less than 200 and falls into the first group (p1) and increase the group count (cntP1) by 1.i = 1– we read the number 2, which again falls into the first group (p1) and increase its count (cntP1) again by 1.i = 2– we read the number 999, which falls into the last group (p5), because its bigger than 800, and increase the count of the group (cntP5) with 1.
After reading the numbers in group p1 we have 2 numbers, and in p5 we have 1 number. We have no numbers in the other groups. By applying the above formula, we calculate the percentages of each group. If we multiply in the formula by 100, instead of 100.0 we will obtain for group p1 66%, and for group p5 – 33% (without fractional part).
Printing the Output
We only have to print the results output. The description says that the percentages must be with precision of two points after the decimal point. To achieve this, write :f2 after the placeholder:
Testing in the Judge System
Test your solution here: https://judge.softuni.org/Contests/Practice/Index/511#0.